Reasoning About Food Placement
Behavioral Diagram
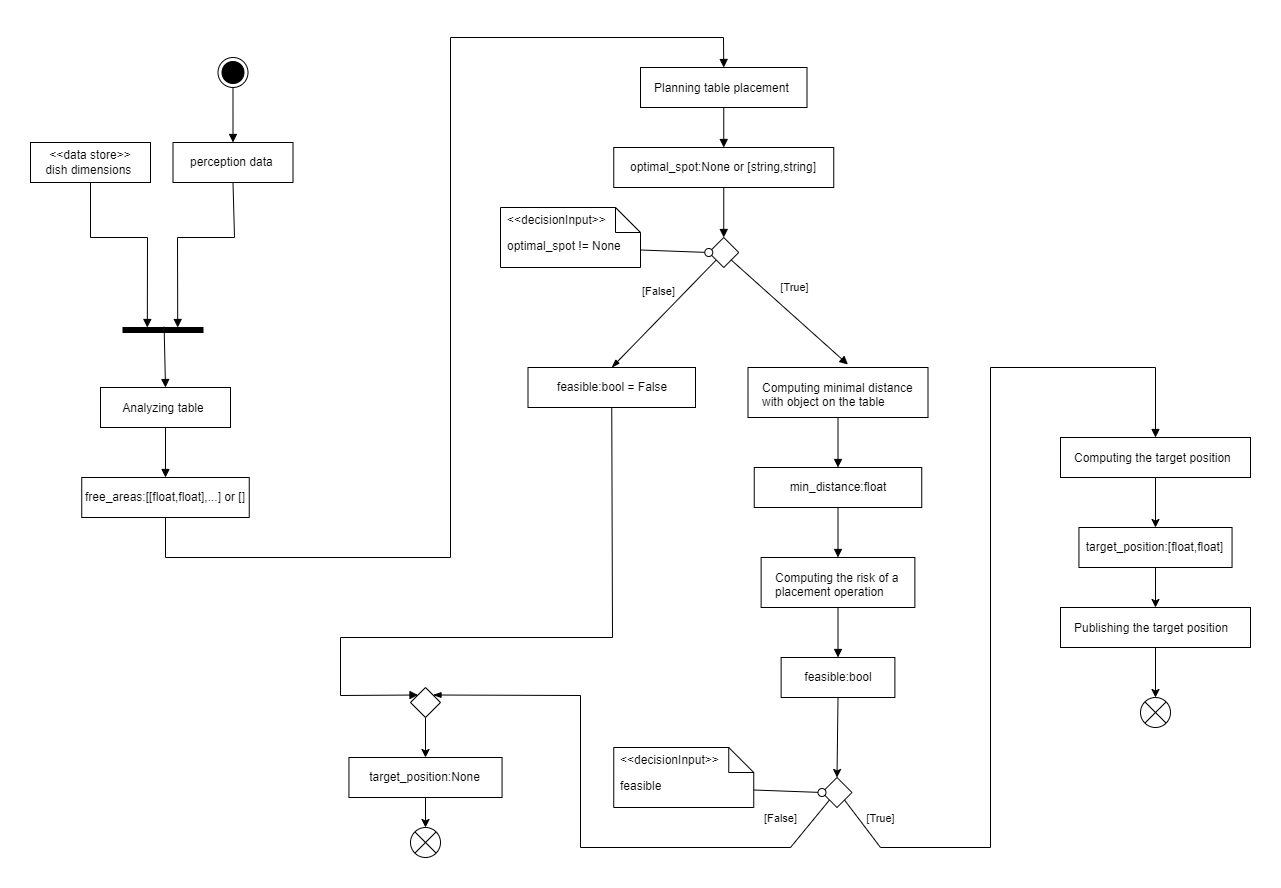
Fig. 3: Reasoning_food_placement activity diagram.
Why activity diagram?
This component performs a defined workflow: analyze table layout, identify free areas, evaluate potential spots based on criteria (stability, space), check for collisions, and finally determine the optimal placement coordinate. An Activity Diagram excels at showing the flow of activities, decision points, and inputs/outputs of such a process.
Description
This activity diagram describes the process followed by the “Reasoning About Food Placement” component to determine a suitable target position for placing a dish on a table.
Inputs:
perception data: Information about the current state of the table (e.g., occupancy grid, object locations).dish dimensions(Data Store): Predefined dimensions of the dish to be placed.
Activity Flow:
Start: The process begins when triggered (e.g., by a request from the TIAGo robot).
Analyzing table: The component uses the
perception dataanddish dimensionsto analyze the table surface. * Output:free_areas(A list of potential free areas, possibly empty if none are found).Planning table placement: Based on the identified
free_areas, the component plans potential placement spots. * Output:optimal_spot(EitherNoneif no suitable spot is found, or data representing the best candidate spot).Decision (optimal_spot != None?): Checks if a potential optimal spot was identified. * [False]: If
optimal_spotisNone, the feasibility is set (feasible_bool = False) and the flow proceeds to the final decision node. * [True]: If anoptimal_spotwas found:- Computing minimal distance with object on the table: Calculates the minimum distance between the proposed placement spot and existing objects on the table using
perception data. Output:
min_distance(The calculated minimum distance).
- Computing minimal distance with object on the table: Calculates the minimum distance between the proposed placement spot and existing objects on the table using
- Computing the risk of a placement operation: Assesses the risk associated with placing the dish at the
optimal_spot, considering themin_distanceand potentially other factors (like stability). Output:
feasible_bool(A boolean indicating if the placement is considered safe/feasible).
- Computing the risk of a placement operation: Assesses the risk associated with placing the dish at the
Decision (feasible?): Checks the result of the risk assessment. * [False]: If the placement is not feasible (
feasible_boolis False), the flow proceeds to the end state with no target position. * [True]: If the placement is feasible (feasible_boolis True):- Computing the target position: Calculates the precise coordinates for the placement.
Output:
target_position(Coordinates [float, float]).
Publishing the target position: Makes the calculated
target_positionavailable (e.g., publishes it on the/target_dish_positionROS topic).Proceeds to the final success state.
End: The activity concludes. Depending on the path taken, either a feasible
target_positionhas been published, or the process determined that no suitable placement could be found (implicitly resulting intarget_position: None).
Unit Test KPIs
Analysis of Table Layouts
Note
For these tests, the table is divided into squares of 1 cm side length.
- Percentage of occupancy grid correctly analyzed (free/occupied):
Computed by incrementing a counter for each square whose state (free or occupied) is correctly guessed by the reasoning component. A square is correctly guessed if the component identifies it as empty when it is truly empty, or identifies it as occupied when it is at least partially occupied on the real table. The final count is divided by the total number of squares on the table and multiplied by 100. This parameter quantifies the accuracy of the table analysis part of the component. Higher percentages indicate greater accuracy.
- Percentage of occupancy grid correctly analyzed (part of free spot):
Computed similarly to the above, but focusing on whether a square is part of a viable free spot for placement. A square is correctly guessed if the component identifies it as part of a free spot when it truly is, or identifies it as not part of a free spot when it is occupied or part of an area too small to be considered a free spot. The final count is divided by the total number of squares and multiplied by 100. This parameter assesses the accuracy in determining usable free spots, ensuring small unusable areas are ignored. Higher percentages indicate greater accuracy.
- Percentage of optimal placement correctly determined:
Computed assuming the free spots are correctly identified. This KPI measures the overlap between the optimal placement area determined by the component and the actual optimal area. The common area is calculated, divided by the area of the plate to be placed, and multiplied by 100. Higher percentages indicate a more effective ability to locate the best placement position.
Analysis of Risk Determination
- Percentage of situations where risks have been guessed correctly:
Evaluated across various scenarios with known optimal placements and objects on the table. The number of times the component correctly determines the risk associated with a placement is counted, divided by the total number of attempts, and multiplied by 100. This parameter assesses the component’s skill in accurately determining risks in realistic situations. Higher percentages indicate better risk assessment ability.
Analysis of Message Transmission
- Percentage of situations where optimal placement messages were correctly sent:
Computed by dividing the number of times the message containing the optimal placement was successfully sent by the total number of attempts to send it, multiplied by 100. This assesses the reliability of the component’s message transmission capability for placement instructions.